Preprocess your data before feeding into any learning algorithm to make it work awesome
Role of data to achieve intelligence for an algorithm
Let’s understand the importance of data for an algorithm with the example of egg and chicken. Can we have egg without chicken? Or vice-versa ? The answer for both the things is no! Similar thing defines the roles of data and algorithm to solve a problem.
As of today the sources of data generation are more than ever before. Most of this ever-growing vast amount of data is in the form of unstructured streams of raw numbers. By applying intelligence to it, we can find pattern and connections that really matter. We can find the meaning hidden in the numbers. That’s where algorithms come into play.
So to make a Machine Learning or Deep Learning algorithm to work we need to feed in the data (lots of data for neural-network based algorithms). That data cannot be fed into an algorithm as it was generated. That needs to be in the form that a machine/deep learning algorithm could understand. We are going to discuss some of the ways to prepare data to be fed into an algorithm.
Preprocessing the data
Preprocessing the data is one of the most important parts of the machine learning pipeline. Once we have decided that what problem we are trying to solve or what question we are looking an answer for, it’s time to choose the right dataset. The solutions which an intelligent algorithm provides are only as good as the data we feed into it. So we want to make sure that the data is relevant to the problem we are trying to solve. There are many resources to find publicly available datasets. UCI is one of the most popular data set repositories which stores almost every type of the dataset (text, image, audio, video) freely available.
There’s so much we could potentially do to our data. We are going to discover few of the techniques here to preprocess the data. List goes below: -
- Scaling
- Standardization
- Normalization
Scaling the data between 0 and 1
Scaling is the method to limit the range of variables so that they can be compared on common grounds. It is performed on continuous variables. Often we rescale the features into the range between 0 and 1. This is useful for many optimization algorithms such as gradient-descent. It is also useful for the algorithms where we supply weighted inputs like in neural-networks.
Python provides scikit-learn library for the data preprocessing. We will be using the same. The full code for this blog can b found at this github link.
Below is the plot of the raw data which we have: -
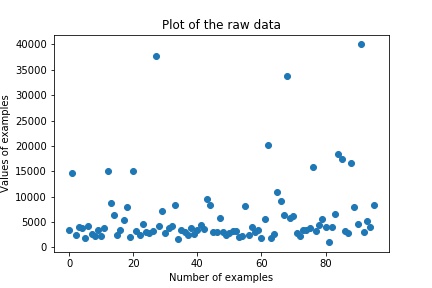
Along the X-Axis we can see the total number of the examples, they are around 100. Along Y-Axis we can see that the range of data that is spread between 0 and 40000. We are going to rescale the data between 0 and 1. We can rescale data using scikit-learn with the MinMaxScaler class.
#scaling between 0 and 1
import scipy
from sklearn.preprocessing import MinMaxScaler
scaler = MinMaxScaler(feature_range=(0, 1))
rescaled_data = scaler.fit_transform(data)
Let’s plot the graph now:
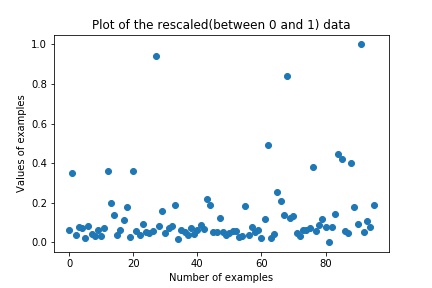
Along the Y-Axis we can see that the distribution of data has changed between 0 and 1.
Standardizing the data (mean 0 and standard deviation 1)
Standardization is a useful technique to transform attributes with a Gaussian distribution and differing means and standard deviations to a standard Gaussian distribution with a mean of 0 and a standard deviation of 1.
It is most suitable for techniques that assume a Gaussian distribution in the input variables and work better with rescaled data, such as linear regression, logistic regression and linear discriminate analysis.
We can standardize the data using scikit-learn with the StandardScaler class. Below is it’s python implementation: -
#Standardize data (0 mean, 1 stdev)
from sklearn.preprocessing import StandardScaler
scaler = StandardScaler().fit(data)
standardized_data = scaler.transform(data)

#below is the mean and standard deviation of the data after standardizing
print("Mean after standardization: {}".format(int(np.mean(standardized_data))))
print("Standard deviation after standardization: {}".format(np.std(standardized_data)))

output:
Mean after standardization: 0
Standard deviation after standardization: 1.0
Let’s plot the graph with standardized data:
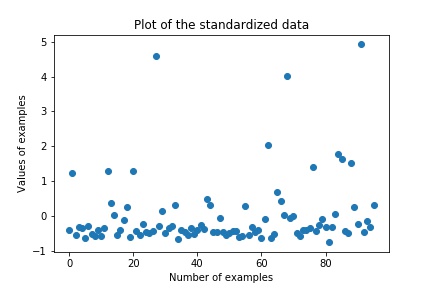
From the above graph along Y-Axis we can see that the data has been rescaled too to the new boundaries(-1 to 5) to make it normalized.
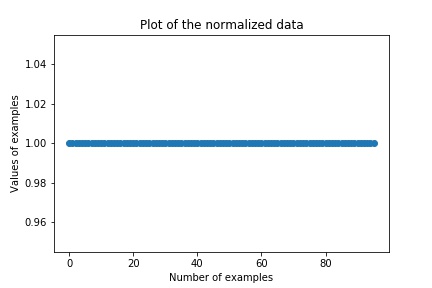
Normalizing the data (make the length of all the data points(rows) 1)
Normalizing a dataset refers to rescaling each observation (row) to have a length of 1 (called a unit norm in linear algebra).
This preprocessing can be useful for sparse datasets (lots of zeros) with attributes of varying scales and while using algorithms which takes weighted inputs such as neural networks.
We can normalize data in Python with scikit-learn using the Normalizer class. Implementation is below: -
#Normalize data (length of 1)
from sklearn.preprocessing import Normalizer
scaler = Normalizer().fit(data)
normalized_data = scaler.transform(data)
Let’s plot the graph with normalized data:
Endnotes:
The aim of this blog is to introduce you with the basic data pre-processing techniques and have a understanding of the practical aspects to apply those techniques.
These methods work because of the underlying assumptions of the algorithms. This is by no means an exhaustive list of the methods. It is advised to experiment with these methods since they can be heavily modified according to the problem at hand.
Hope you enjoyed the post..